

What You’ll Learn
In this lesson, you’ll use AWS CLI CloudWatch Logs commands to investigate application failures from the command line. You will learn how to search across a log group, retrieve events from a specific stream, and shape the returned data into useful output.
- Filter application logs for messages such as
ERROR. - Convert a time range into the epoch milliseconds required by CloudWatch Logs.
- Retrieve recent events from an individual log stream.
- Avoid common issues involving pagination, permissions, and timestamps.
The Concept
CloudWatch Logs stores application output in log groups and log streams. A log group commonly represents an application or service, while a stream often represents a particular container, host, or execution instance.
The AWS CLI provides several commands for working with these logs:
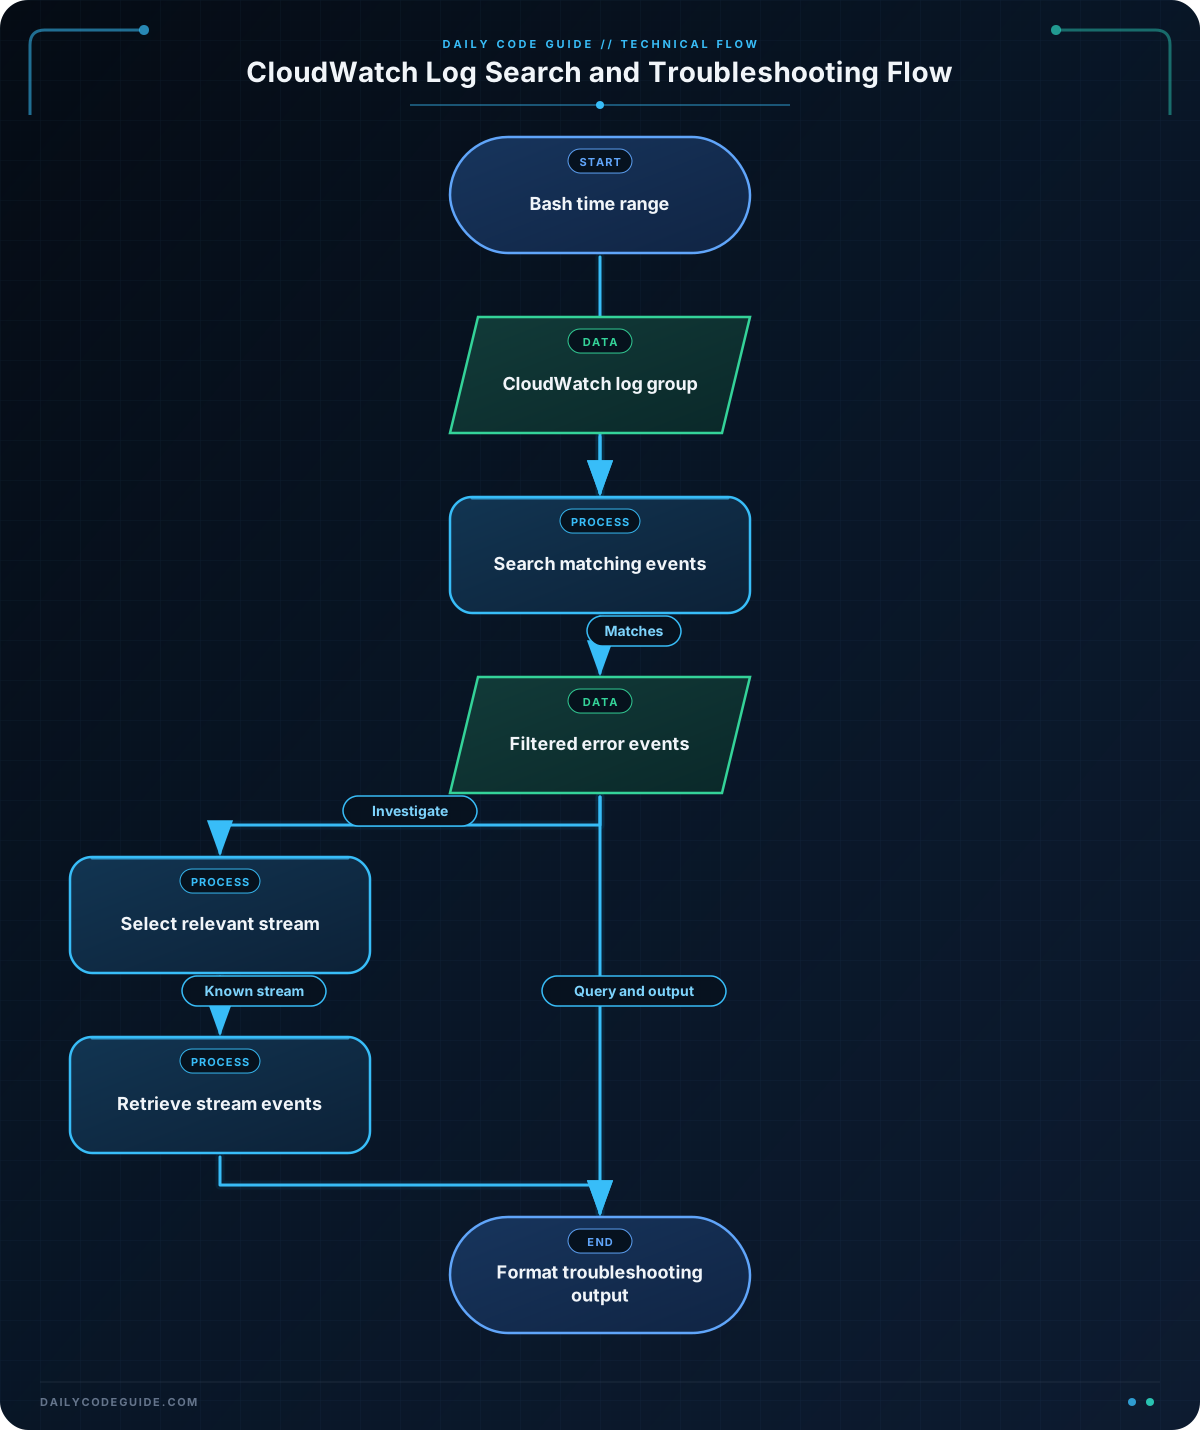
filter-log-eventssearches events across one or more streams in a log group.describe-log-streamslists streams and metadata such as their most recent event time.get-log-eventsretrieves events from one specific stream.
For application troubleshooting, filter-log-events is usually the best starting point because you can search a time range and return only messages matching a filter pattern. Once you identify a stream of interest, get-log-events can provide more focused context.
CloudWatch Logs expects --start-time and --end-time values as epoch time in milliseconds. The examples use the Bash date command to calculate a recent time range.
Basic Example
The following command searches the /applications/orders log group for events containing ERROR from the last 15 minutes. It returns the event timestamp, message, and stream name.
#!/usr/bin/env bash

LOG_GROUP="/applications/orders"
START_TIME=$(date -d "15 minutes ago" +%s000)

aws logs filter-log-events \
    --log-group-name "$LOG_GROUP" \
    --start-time "$START_TIME" \
    --filter-pattern "ERROR" \
    --query 'events[*].[timestamp,logStreamName,message]' \
    --output table
The date -d syntax is available on GNU/Linux systems. On macOS, you can replace the time calculation with START_TIME=$(($(date +%s) - 900))000.
Expected Output
The exact events depend on your account and application. The table will have a structure similar to this:
--------------------------------------------------------------
|                       FilterLogEvents                     |
+---------------+----------------------+-------------------+
|  1710000123456| 2024-03-09/orders-1  | ERROR Database... |
|  1710000456789| 2024-03-09/orders-2  | ERROR Timeout...  |
+---------------+----------------------+-------------------+
How the Code Works
--log-group-name identifies the group to search. The group must already exist, and its name is case-sensitive.
--start-time limits the search to events after the supplied epoch-millisecond value. If you omit --end-time, CloudWatch Logs searches through the current time.
--filter-pattern "ERROR" searches for events containing the term ERROR. CloudWatch Logs filter patterns support more than simple terms. For example, quoted phrases can search for an exact phrase, and JSON log fields can be filtered with expressions such as { $.level = "ERROR" } when your application writes structured JSON logs.
The --query option is a client-side JMESPath expression. Here, it selects three fields from every event:
timestamp: the event time in epoch milliseconds.logStreamName: the stream that produced the event.message: the application log message.
Finally, --output table makes the result easier to scan during an interactive investigation. Use --output json or --output text when another script will process the result.
Filtering happens on the CloudWatch Logs service, which is more useful than downloading every event and searching locally. However, the response is paginated. The AWS CLI normally follows pagination for this command, but a very large time range or broad filter can still produce a substantial response. Narrow the time range and use a specific filter pattern when possible.
Another Example
After finding a problem, you may want to inspect the most recently active stream directly. This example lists streams by their latest event time, selects the first stream, and retrieves up to 50 recent events from it.
#!/usr/bin/env bash

LOG_GROUP="/applications/orders"

LATEST_STREAM=$(aws logs describe-log-streams \
    --log-group-name "$LOG_GROUP" \
    --order-by LastEventTime \
    --descending \
    --max-items 1 \
    --query 'logStreams[0].logStreamName' \
    --output text)

if [ "$LATEST_STREAM" = "None" ] || [ -z "$LATEST_STREAM" ]; then
    printf 'No log streams were found in %s\n' "$LOG_GROUP"
    exit 0
fi

printf 'Recent events from stream: %s\n' "$LATEST_STREAM"

aws logs get-log-events \
    --log-group-name "$LOG_GROUP" \
    --log-stream-name "$LATEST_STREAM" \
    --limit 50 \
    --start-from-head false \
    --query 'events[*].[timestamp,message]' \
    --output table
This approach is useful when a service writes each container or host to a separate stream and you want to inspect the stream with the newest activity. The stream’s latest-event metadata can be briefly stale, so treat the result as a useful starting point rather than an absolute real-time guarantee.
Common Mistakes
- Using seconds instead of milliseconds:
date +%sreturns seconds. CloudWatch Logs requires milliseconds, so the example appends000. - Searching the wrong group or region: AWS CLI commands use the configured region unless you provide
--region. Confirm both the log group and region before troubleshooting the command. - Expecting
get-log-eventsto search a group: This command requires one specific stream. Usefilter-log-eventswhen you do not yet know which stream contains the error. - Forgetting permissions: The identity running these commands generally needs permissions such as
logs:FilterLogEvents,logs:DescribeLogStreams, andlogs:GetLogEvents. - Assuming a plain word is a full-text regular expression: CloudWatch filter patterns have their own syntax. They are not regular expressions by default. Use documented filter-pattern expressions for terms, phrases, exclusions, or JSON fields.
Try It Yourself
Choose a log group from your account and modify the first example so that it searches the last 30 minutes for messages containing Timeout. Return the timestamp, stream name, and message as JSON instead of a table.
As a follow-up, change the filter pattern to search for the exact phrase connection refused. Compare the results with a search for the individual term connection.
Challenge
Write a Bash script that searches the /applications/payments log group for the last 30 minutes and displays application errors.
Your script must:
- Calculate the start time in epoch milliseconds.
- Search for events containing
ERROR. - Return the timestamp, log stream name, and message.
- Limit the displayed results to 100 events.
- Use JSON output so the results can be passed to another automation step later.
- Print a useful message if no matching events are returned.
Solution
#!/usr/bin/env bash

LOG_GROUP="/applications/payments"
START_TIME=$(date -d "30 minutes ago" +%s000)

ERROR_EVENTS=$(aws logs filter-log-events \
    --log-group-name "$LOG_GROUP" \
    --start-time "$START_TIME" \
    --filter-pattern "ERROR" \
    --limit 100 \
    --query 'events[*].[timestamp,logStreamName,message]' \
    --output json)

if [ "$ERROR_EVENTS" = "[]" ]; then
    printf 'No ERROR events found in %s during the last 30 minutes.\n' "$LOG_GROUP"
else
    printf '%s\n' "$ERROR_EVENTS"
fi
The command searches only the required time window, limits the response to 100 events, and selects the three fields needed for investigation. Because the output is JSON, a later pipeline can pass it to a JSON parser or store it as an incident artifact. The empty-array check handles the case where the command succeeds but no matching events exist.
On macOS, replace the START_TIME assignment with:
START_TIME=$(($(date +%s) - 1800))000Key Takeaways
filter-log-eventssearches for matching events across a CloudWatch Logs group.get-log-eventsretrieves events from one known log stream.- CloudWatch Logs time arguments use epoch milliseconds, not seconds.
- Use
--queryto select useful fields and--outputto choose a format for people or scripts. - Narrow time ranges and precise filter patterns make log investigations faster and easier to automate.