


What You’ll Learn
In this lesson, you will use the AWS CLI to query EC2 CPU utilization and create an Amazon CloudWatch alarm for sustained high CPU usage. You will also learn how to inspect, update, disable, and remove alarms from the command line.
- Query the
AWS/EC2CPUUtilizationmetric. - Understand metric dimensions, periods, statistics, and thresholds.
- Create and inspect a CPU utilization alarm.
- Manage an existing alarm with CloudWatch commands.
The Concept
CloudWatch metrics are time-series measurements collected from AWS resources. For an EC2 instance, the CPUUtilization metric reports the percentage of CPU capacity being used.
The AWS CLI provides several CloudWatch commands for working with these metrics:
get-metric-statisticsretrieves statistics for one metric over a time range.get-metric-dataretrieves one or more metrics using metric data queries.put-metric-alarmcreates or updates an alarm.describe-alarmsdisplays alarm configuration and current state.disable-alarm-actionsandenable-alarm-actionscontrol notification or remediation actions.delete-alarmsremoves alarms.
A metric is identified by its namespace, metric name, and dimensions. In this lesson, the namespace is AWS/EC2, the metric name is CPUUtilization, and the dimension identifies a particular instance:
Namespace: AWS/EC2
Metric: CPUUtilization
Dimension: InstanceId=i-0123456789abcdef0
CloudWatch alarms evaluate metric data over one or more periods. For example, an alarm with a five-minute period and two evaluation periods can enter the ALARM state when CPU usage is above its threshold for two consecutive five-minute periods.
Basic Example
The following Bash session queries the average CPU utilization of one EC2 instance for the last 15 minutes and then creates an alarm when the average exceeds 70 percent for two consecutive five-minute periods.
Replace the instance ID and region with values from your AWS account. The commands use the default AWS CLI profile.
#!/usr/bin/env bash

set -euo pipefail

INSTANCE_ID="i-0123456789abcdef0"
REGION="us-east-1"
ALARM_NAME="production-web-high-cpu"

START_TIME=$(date -u -d "15 minutes ago" +"%Y-%m-%dT%H:%M:%SZ")
END_TIME=$(date -u +"%Y-%m-%dT%H:%M:%SZ")

aws cloudwatch get-metric-statistics \
    --namespace AWS/EC2 \
    --metric-name CPUUtilization \
    --dimensions Name=InstanceId,Value="$INSTANCE_ID" \
    --start-time "$START_TIME" \
    --end-time "$END_TIME" \
    --period 300 \
    --statistics Average \
    --region "$REGION" \
    --query 'sort_by(Datapoints, &Timestamp)[].{Timestamp:Timestamp,Average:Average}' \
    --output json

aws cloudwatch put-metric-alarm \
    --alarm-name "$ALARM_NAME" \
    --alarm-description "Alarm when EC2 CPU stays above 70 percent" \
    --namespace AWS/EC2 \
    --metric-name CPUUtilization \
    --dimensions Name=InstanceId,Value="$INSTANCE_ID" \
    --statistic Average \
    --period 300 \
    --evaluation-periods 2 \
    --datapoints-to-alarm 2 \
    --threshold 70 \
    --comparison-operator GreaterThanThreshold \
    --treat-missing-data notBreaching \
    --region "$REGION"

aws cloudwatch describe-alarms \
    --alarm-names "$ALARM_NAME" \
    --region "$REGION" \
    --query 'MetricAlarms[].{Name:AlarmName,State:StateValue,Reason:StateReason,Threshold:Threshold,Periods:EvaluationPeriods}' \
    --output table
The date commands create UTC timestamps. On macOS, the BSD date command does not support -d; use an equivalent timestamp-generation command for your operating system.
Expected Output
The metric query returns the available five-minute datapoints. The exact timestamps and values depend on the instance’s recent activity.
[
    {
        "Timestamp": "2025-03-08T14:40:00+00:00",
        "Average": 24.781
    },
    {
        "Timestamp": "2025-03-08T14:45:00+00:00",
        "Average": 31.204
    },
    {
        "Timestamp": "2025-03-08T14:50:00+00:00",
        "Average": 28.917
    }
]
The alarm inspection command displays the alarm name, current state, threshold, and number of evaluation periods. A newly created alarm may initially be in the INSUFFICIENT_DATA state while CloudWatch waits for enough datapoints.
How the Code Works
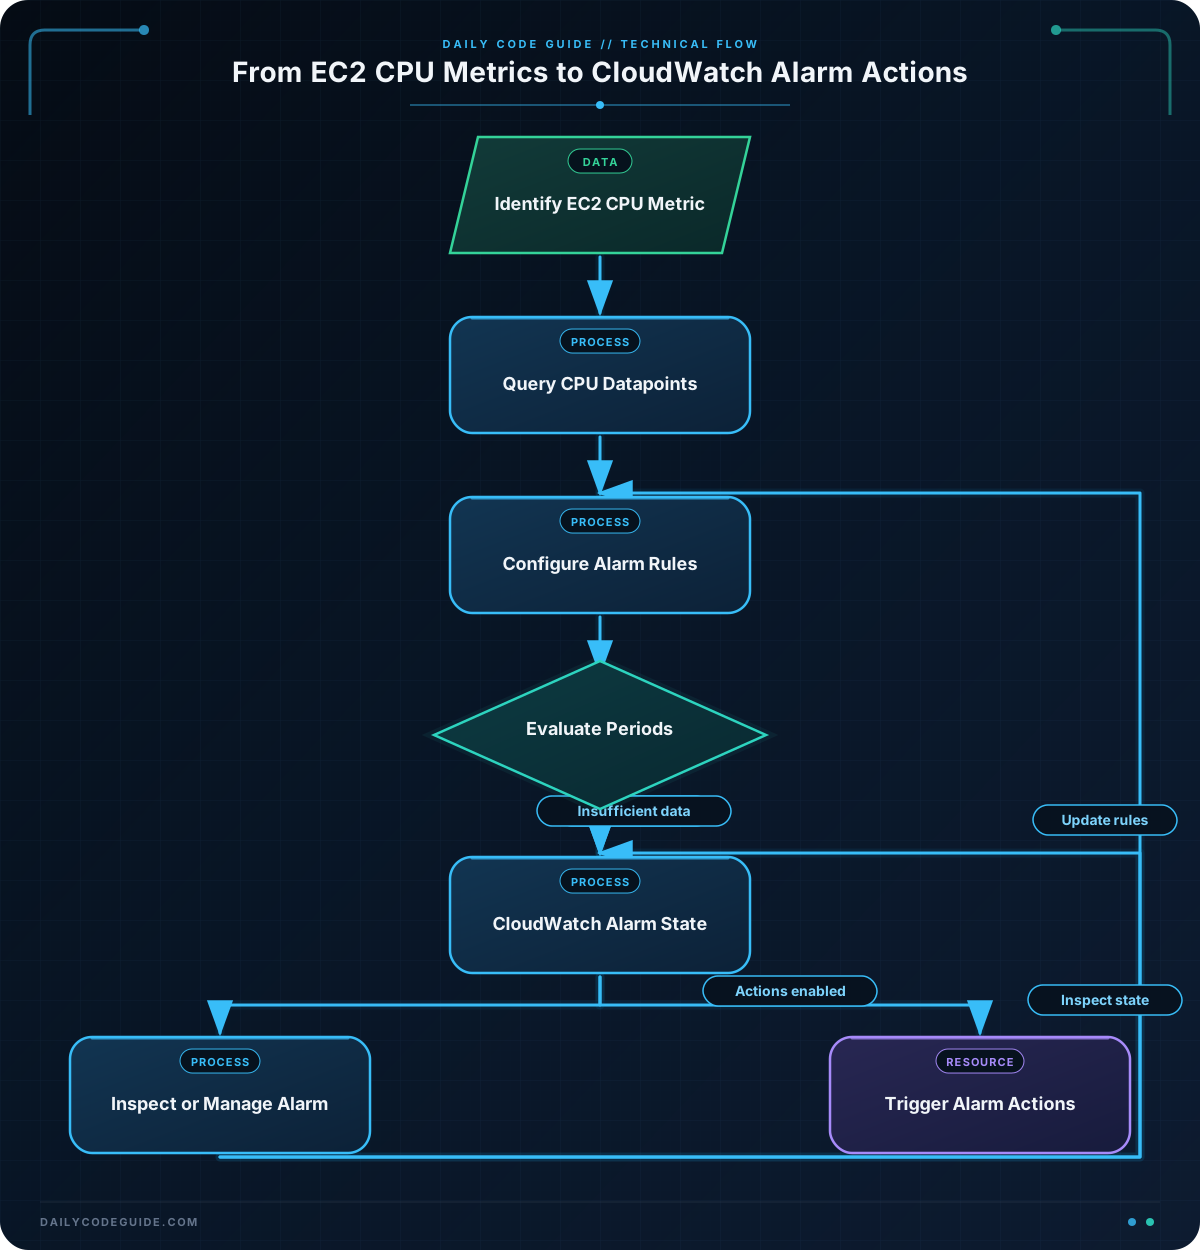
get-metric-statistics requires a time range and a period. Here, --period 300 requests five-minute intervals, while --statistics Average asks CloudWatch to calculate the average CPU value for each interval.
The --dimensions argument is important. EC2 publishes CPU utilization separately for each instance, so omitting Name=InstanceId,Value=... will not identify the intended instance.
The JMESPath expression passed to --query sorts datapoints by timestamp and keeps only the timestamp and average value. This makes the result easier to read than the full response, which can also contain other statistic fields.
put-metric-alarm creates the alarm if it does not exist. If an alarm with the same name already exists, the command updates its configuration. In this example:
--threshold 70sets the CPU percentage limit.--comparison-operator GreaterThanThresholdtriggers when the value is above 70.--evaluation-periods 2evaluates two consecutive five-minute periods.--datapoints-to-alarm 2requires both periods to breach the threshold.--treat-missing-data notBreachingprevents missing data from triggering the alarm.
This alarm has no --alarm-actions value, so it changes state but does not send an SNS notification or start an automated recovery action. In production, you would typically add an SNS topic ARN or another appropriate action after deciding how the alert should be handled.
Another Example
Alarm configuration often changes as an application moves between environments. The following commands inspect a CPU alarm, temporarily disable its actions during planned maintenance, update its threshold to 85 percent, and then re-enable the actions.
#!/usr/bin/env bash

set -euo pipefail

REGION="us-east-1"
ALARM_NAME="production-web-high-cpu"

printf '%s\n' 'Current alarm details:'
aws cloudwatch describe-alarms \
    --alarm-names "$ALARM_NAME" \
    --region "$REGION" \
    --query 'MetricAlarms[].{Name:AlarmName,State:StateValue,Updated:AlarmConfigurationUpdatedTimestamp,Actions:AlarmActions}' \
    --output json

printf '\n%s\n' 'Disabling alarm actions for maintenance:'
aws cloudwatch disable-alarm-actions \
    --alarm-names "$ALARM_NAME" \
    --region "$REGION"

printf '\n%s\n' 'Raising the threshold to 85 percent:'
aws cloudwatch put-metric-alarm \
    --alarm-name "$ALARM_NAME" \
    --alarm-description "Alarm when EC2 CPU stays above 85 percent" \
    --namespace AWS/EC2 \
    --metric-name CPUUtilization \
    --dimensions Name=InstanceId,Value=i-0123456789abcdef0 \
    --statistic Average \
    --period 300 \
    --evaluation-periods 3 \
    --datapoints-to-alarm 2 \
    --threshold 85 \
    --comparison-operator GreaterThanThreshold \
    --treat-missing-data notBreaching \
    --region "$REGION"

printf '\n%s\n' 'Re-enabling alarm actions:'
aws cloudwatch enable-alarm-actions \
    --alarm-names "$ALARM_NAME" \
    --region "$REGION"

aws cloudwatch describe-alarms \
    --alarm-names "$ALARM_NAME" \
    --region "$REGION" \
    --query 'MetricAlarms[].{Name:AlarmName,State:StateValue,Threshold:Threshold,EvaluationPeriods:EvaluationPeriods,DatapointsToAlarm:DatapointsToAlarm}' \
    --output table
This is different from simply creating an alarm: it demonstrates operational management. The updated policy allows up to three five-minute periods to be evaluated, and at least two of those periods must exceed 85 percent before the alarm enters the ALARM state.
Common Mistakes
- Using the wrong region: CloudWatch metrics and alarms are regional. Always pass the region containing the EC2 instance, or configure the correct default region.
- Omitting the instance dimension: EC2 CPU metrics are associated with an
InstanceId. A missing or incorrect dimension can produce no datapoints. - Confusing period and evaluation periods: A 300-second period is five minutes. Two evaluation periods means CloudWatch considers two five-minute periods; it does not mean two minutes.
- Expecting an alarm to notify someone automatically: An alarm without
--alarm-actionsonly changes state. Add an SNS topic ARN or another supported action when notifications are required. - Assuming a new alarm immediately has a definitive state: CloudWatch may report
INSUFFICIENT_DATAuntil enough metric data has arrived. - Deleting an alarm during troubleshooting: If you only need to silence notifications, use
disable-alarm-actionsinstead ofdelete-alarms.
Try It Yourself
Choose a running EC2 instance and use get-metric-statistics to retrieve its maximum CPU utilization for the last hour. Use 300-second periods and sort the returned datapoints by timestamp. Then inspect the result and decide whether an average-based or maximum-based alarm better fits your workload.
Challenge
Create a CloudWatch alarm for a different EC2 instance with these requirements:
- Use the
AWS/EC2CPUUtilizationmetric. - Use the instance’s
InstanceIddimension. - Set the statistic to
Maximum. - Use five-minute periods.
- Require two out of three periods to exceed 80 percent.
- Treat missing data as not breaching.
- Query the alarm afterward and display its name, state, threshold, and datapoint requirements.
Solution
#!/usr/bin/env bash

set -euo pipefail

INSTANCE_ID="i-0fedcba9876543210"
REGION="us-west-2"
ALARM_NAME="api-server-maximum-cpu"

aws cloudwatch put-metric-alarm \
    --alarm-name "$ALARM_NAME" \
    --alarm-description "Alarm when API server maximum CPU exceeds 80 percent" \
    --namespace AWS/EC2 \
    --metric-name CPUUtilization \
    --dimensions Name=InstanceId,Value="$INSTANCE_ID" \
    --statistic Maximum \
    --period 300 \
    --evaluation-periods 3 \
    --datapoints-to-alarm 2 \
    --threshold 80 \
    --comparison-operator GreaterThanThreshold \
    --treat-missing-data notBreaching \
    --region "$REGION"

aws cloudwatch describe-alarms \
    --alarm-names "$ALARM_NAME" \
    --region "$REGION" \
    --query 'MetricAlarms[].{Name:AlarmName,State:StateValue,Threshold:Threshold,Statistic:Statistic,Period:Period,EvaluationPeriods:EvaluationPeriods,DatapointsToAlarm:DatapointsToAlarm}' \
    --output table
The solution uses Maximum rather than Average, so a short CPU spike can count as a breach for a five-minute period. With three evaluation periods and --datapoints-to-alarm 2, at least two of the three periods must exceed 80 percent.
Key Takeaways
- Use
get-metric-statisticsto query EC2 CPU utilization over a specific time range. - CloudWatch metric dimensions, especially
InstanceId, determine which resource is being measured. put-metric-alarmcreates a new alarm or updates an existing alarm with the same name.- Periods, evaluation periods, and datapoints-to-alarm control how sustained a condition must be before triggering.
- Inspect alarms with
describe-alarms, and disable actions when you need to silence notifications without deleting the alarm.