
What You’ll Learn
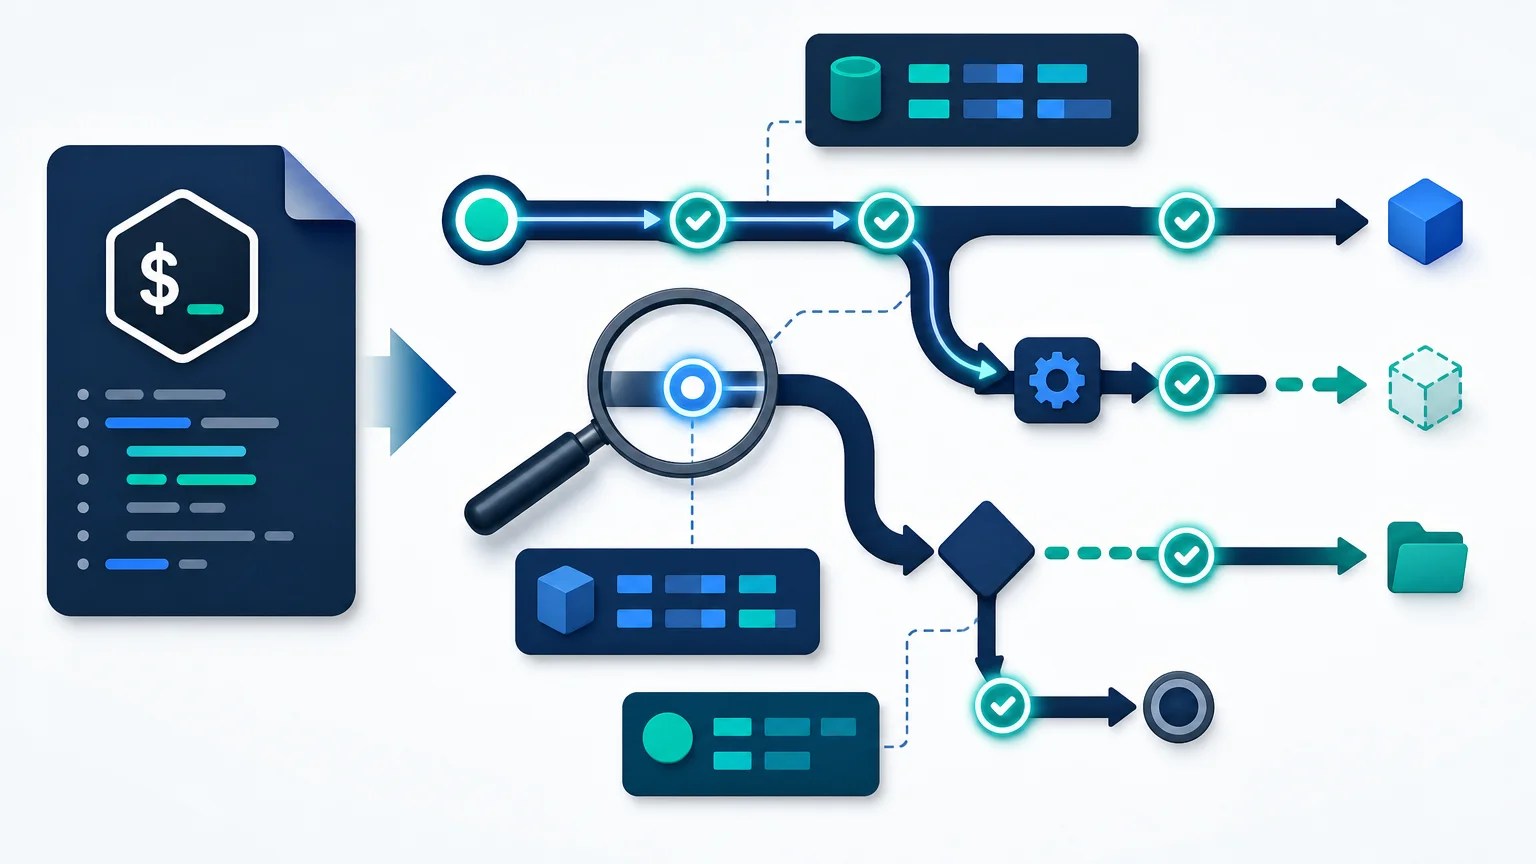
When an automation script behaves unexpectedly, it can be difficult to tell which commands actually ran and what values Bash used. In this lesson, you will learn how to use set -x to trace commands as Bash executes them.
- Enable command tracing with
set -x. - Read expanded variables in Bash trace output.
- Disable tracing with
set +x. - Use tracing to diagnose unexpected commands and variable values.
The Concept
Bash normally runs commands without displaying each command first. This is convenient during normal operation, but it makes debugging harder when a script uses the wrong directory, environment, or filename.
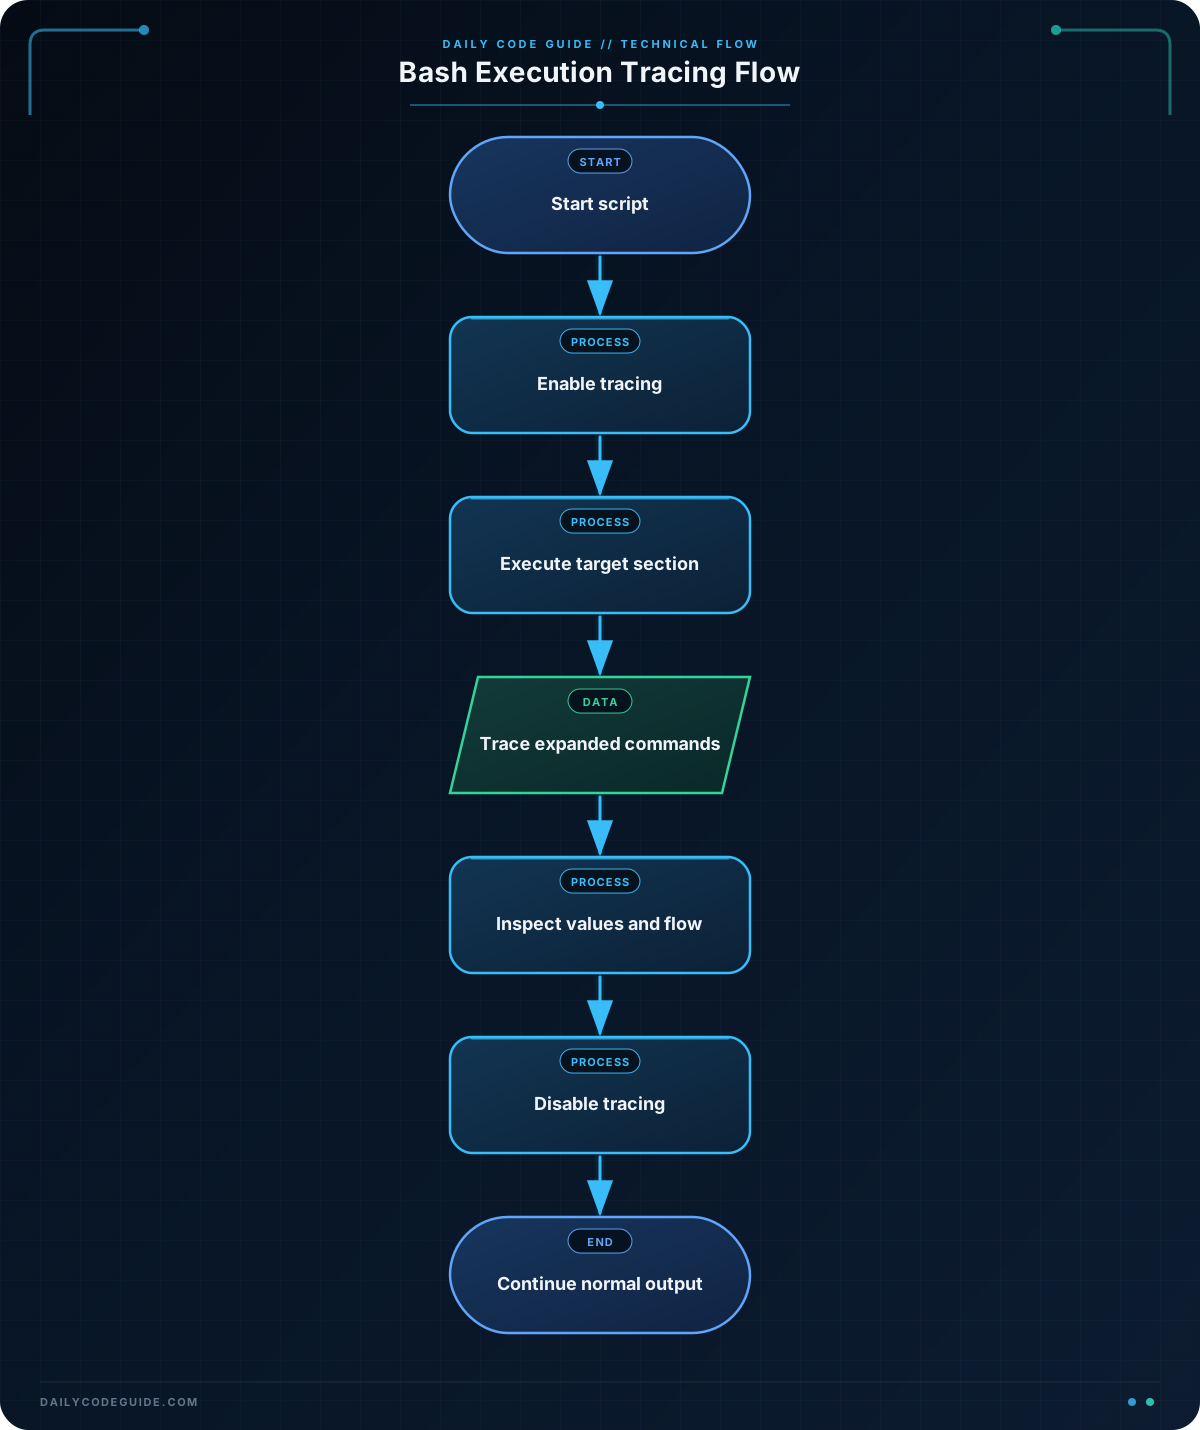
The Bash command set -x turns on execution tracing. After tracing is enabled, Bash displays each command before it runs. Variables are expanded before the command is shown, so the trace reveals the values Bash is actually using.
For example, if a script contains:
printf 'Deploying to %s\n' "$environment"and environment contains staging, the trace will show a command similar to:
+ printf 'Deploying to %s\n' stagingThe leading + is Bash’s usual trace prefix. The trace is commonly written to standard error, while the script’s normal output is written to standard output. This means the two types of output may appear together in your terminal but have different destinations.
Tracing is useful when you need to answer questions such as:
- Did the function run?
- Which directory did the script create?
- What filename did a variable expand to?
- Did the script use
stagingorproduction?
Basic Example
This automation script prepares a deployment directory. Tracing is enabled only around the part we want to inspect and is disabled before the final status message.
#!/usr/bin/env bash

environment="staging"
deploy_directory="/tmp/daily-code-guide-deploy"
artifact="release-2025-01.tar.gz"

prepare_deployment() {
    printf 'Preparing %s deployment\n' "$environment"
    mkdir -p "$deploy_directory"
    printf 'Artifact: %s\n' "$artifact"
}

set -x
prepare_deployment
printf 'Deployment directory: %s\n' "$deploy_directory"
set +x

printf 'Tracing is now disabled.\n'
Expected Output
The exact trace formatting can vary slightly between Bash versions, but it will show the function call and the expanded variable values:
+ prepare_deployment
+ printf 'Preparing %s deployment\n' staging
Preparing staging deployment
+ mkdir -p /tmp/daily-code-guide-deploy
+ printf 'Artifact: %s\n' release-2025-01.tar.gz
Artifact: release-2025-01.tar.gz
+ printf 'Deployment directory: %s\n' /tmp/daily-code-guide-deploy
Deployment directory: /tmp/daily-code-guide-deploy
Tracing is now disabled.
How the Code Works
The first three assignments define the values used by the automation task:
environment="staging"
deploy_directory="/tmp/daily-code-guide-deploy"
artifact="release-2025-01.tar.gz"
The function uses these variables. The double quotes around each variable protect values that contain spaces or other special characters.
This line enables tracing:
set -xFrom this point forward, Bash prints commands before executing them. Notice that the trace shows staging rather than the variable name $environment. That expansion is especially useful when a variable unexpectedly contains the wrong value.
The function call is traced too:
+ prepare_deploymentThen Bash traces the commands inside the function. This helps you follow the full path through a script, including function calls.
This line turns tracing off:
set +xTracing should usually be enabled for the smallest useful section. Leaving it enabled can make normal output noisy, and it can expose sensitive values such as passwords, access tokens, or private filenames. Do not enable tracing around commands that contain secrets.
You can also start a script with tracing from the command line without editing the file:
bash -x deploy.shThis is useful for a quick investigation. For scripts running automatically, such as jobs that schedule Bash scripts with cron, temporary tracing inside the script can reveal differences between your interactive shell and the cron environment.
Another Example
Here is a different automation scenario: a script builds commands for a remote deployment step. The commands are displayed rather than sent to a server, so you can safely inspect the values before adding an SSH command.
#!/usr/bin/env bash

target_host="staging-server"
release_directory="/srv/app"
archive_file="/tmp/releases/app-2025-01.tar.gz"

run_remote_step() {
    printf 'Remote step for %s: %s\n' "$target_host" "$1"
}

PS4='+ ${LINENO}: '
set -x
run_remote_step "mkdir -p $release_directory"
run_remote_step "tar -xzf $archive_file -C $release_directory"
set +x

printf 'Remote command review complete.\n'
Here, PS4 changes the trace prefix to include the source line number. This makes it easier to locate an unexpected command in a longer script. When you are ready to execute real commands on another server, the same type of inspection can help you run remote commands with Bash and SSH more safely.
Common Mistakes
- Forgetting to turn tracing off: Use
set +xafter the section you are investigating. Otherwise, every later command will also be traced. - Confusing trace output with normal output: Lines beginning with
+are Bash’s trace messages. They are not printed by your script’sprintfcommands. - Expecting
set -xto show the original source exactly: The trace shows commands after variable expansion. This is intentional because it reveals the values Bash uses. - Tracing sensitive data: Expanded values can appear in the trace. Avoid tracing commands that include passwords, tokens, or other secrets.
- Tracing too much code: Start tracing immediately before the suspicious function or command and stop it immediately afterward. A smaller trace is easier to read.
Try It Yourself
Add tracing to this script so you can verify which environment and configuration file are used. Enable tracing before the function call and disable it afterward.
#!/usr/bin/env bash

environment="staging"
config_file="/etc/app/staging.conf"

show_configuration() {
    printf 'Environment: %s\n' "$environment"
    printf 'Configuration file: %s\n' "$config_file"
}

show_configuration
After running it, check whether the trace displays staging and the expected configuration path.
Challenge
The following script is intended to prepare a report directory, but the automation output does not make it clear which directory is being used.
Update the script to meet these requirements:
- Enable tracing only around the
prepare_reportfunction call. - Use a trace prefix that includes the line number.
- Disable tracing before the final message.
- Keep the directory variable quoted.
#!/usr/bin/env bash

report_environment="staging"
report_directory="/tmp/daily-code-guide-reports"

prepare_report() {
    mkdir -p "$report_directory"
    printf 'Preparing reports for %s\n' "$report_environment"
}

prepare_report
printf 'Report preparation finished.\n'
Solution
#!/usr/bin/env bash

report_environment="staging"
report_directory="/tmp/daily-code-guide-reports"

prepare_report() {
    mkdir -p "$report_directory"
    printf 'Preparing reports for %s\n' "$report_environment"
}

PS4='+ ${LINENO}: '
set -x
prepare_report
set +x

printf 'Report preparation finished.\n'
PS4 adds the line number to each trace message. The placement of set -x and set +x limits tracing to the function call, so the final message is not traced. The quoted "$report_directory" safely passes the directory path to mkdir.
Key Takeaways
set -xdisplays Bash commands as they execute.- Trace output shows expanded variable values, which helps reveal unexpected settings.
- Use
set +xto stop tracing when the diagnostic section ends. - Tracing is useful for automation scripts, but it can expose sensitive values.
- A customized
PS4prefix can add helpful information such as source line numbers.